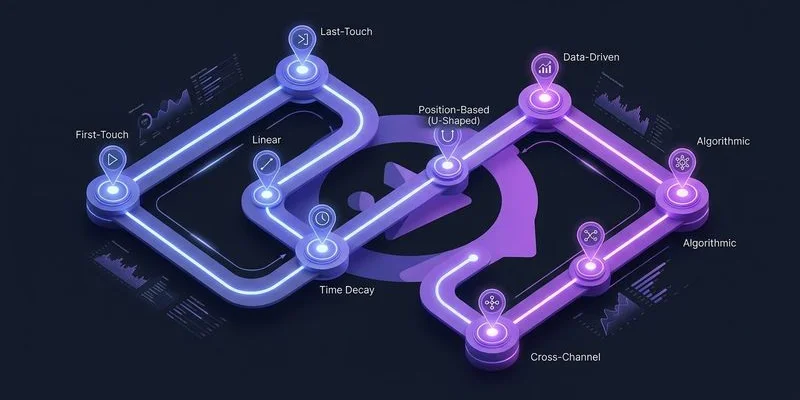
8 Attribution Models Explained: Which One Should You Use?
First Touch, Last Touch, Linear, Time Decay, Position-Based, and more. A clear breakdown of 8 attribution models with real-world examples for each.
ONClix Team
My team and I have spent years auditing marketing accounts, and we consistently see one expensive pattern: business owners pouring money into the “closer” channels while neglecting the ones that actually find new customers.
Attribution is the only way to stop this bleeding.
Our analysis of recent 2025 industry data shows that companies without a clear attribution strategy misallocate up to 30% of their annual budget.
The model you choose determines where that money goes. The right marketing attribution software makes implementing any of these models straightforward.
This guide breaks down the 8 major attribution models you need to know, backed by the strategies we use to help our clients stop guessing and start growing.
1. First-Touch Attribution
First-touch attribution assigns 100% of the conversion credit to the very first interaction a customer has with your brand.
If a prospect finds you via a blog post on “kitchen remodeling costs” and converts three months later after seeing five retargeting ads, that initial blog post gets all the glory.
When to use it: We recommend this model strictly for aggressive growth phases where your only goal is net-new lead volume.
It tells you exactly which top-of-funnel content is filling your pipeline. A 2025 report from MarketingLTB found that social media now influences 41% of these first-touch discoveries, making this model vital for justifying brand awareness spend.
The “Insider” Insight: Be careful with the “Viral Trap.” A low-quality viral social post might bring in 10,000 visitors who never buy, but First-Touch will claim it’s your best channel. You must pair this model with a lead quality report to ensure you aren’t optimizing for “junk” traffic.
Pros: Simple to set up; excellent for proving the ROI of SEO and content marketing.
Cons: It completely ignores the nurturing process. Your sales team might be closing deals via email and phone calls that this model claims are “worthless.”
2. Last-Touch Attribution
Last-touch attribution is the mirror image of first-touch.
It gives 100% of the credit to the final interaction before the sale.
When to use it: This is the default setting for many basic analytics tools because it claims the credit for the platform that “closed” the deal.
Use it only if you have a very short sales cycle (like emergency plumbing) where customers buy immediately after clicking.
The “Retargeting Illusion”: We often see Google Ads accounts that look incredibly profitable under Last-Touch because they bid on the company’s own brand name. The customer was already going to buy, but they clicked an ad to get to the site. Last-Touch gives the ad credit for a sale that would have happened anyway.
Pros: Easy to validate against your bank account; requires zero configuration in most tools.
Cons: It creates a “bottom-feeder” strategy where you stop spending on growth and only spend on harvesting existing demand. Recent 2025 data suggests relying solely on this model overvalues bottom-funnel ads by 40-70%.
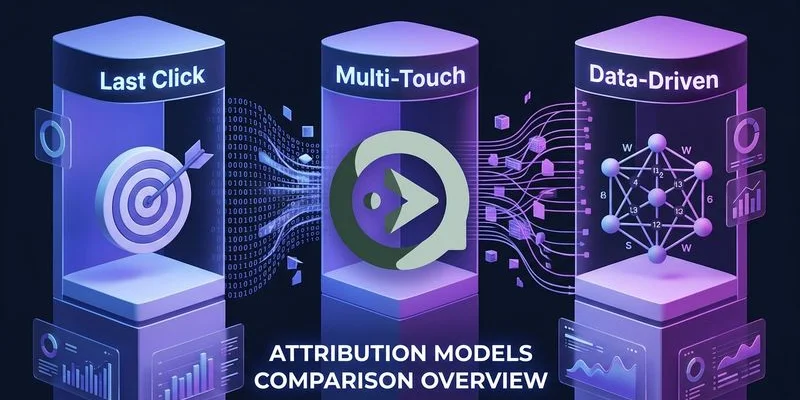
Comparison: First-Touch vs. Last-Touch
| Feature | First-Touch Attribution | Last-Touch Attribution |
|---|---|---|
| Credit Assignment | 100% to the initial discovery point. | 100% to the final closing action. |
| Best For | High-growth startups needing awareness. | Businesses with immediate, impulse purchases. |
| Major Blindspot | Ignores the closing/sales process. | Ignores how customers found you. |
| Primary Risk | Scaling low-quality traffic sources. | Cutting off the flow of new leads. |
3. Linear Attribution
Linear attribution spreads the credit evenly across every single interaction in the journey.
If a customer hits 10 touchpoints before buying, each one gets 10% of the credit.
When to use it: This model is useful when your marketing channels are designed to keep the brand “top of mind” over a long period.
We often use it as a “sanity check” to see if a channel is contributing at all, even if it’s not starting or finishing the journey.
The “Participation Trophy” Problem: Linear attribution treats a casual 2-second banner view the same as a 45-minute webinar attendance. This flattens your data. It makes it hard to see which channels are doing the heavy lifting versus which ones are just tagging along.
Pros: It acknowledges that every touchpoint matters; it is more balanced than single-touch models.
Cons: It provides no opinion on what is most important. You cannot easily optimize your budget because every channel looks moderately successful.
4. Time-Decay Attribution
Time-decay attribution gives more credit to actions that happened closer to the conversion.
The logic follows a “half-life” concept: a touchpoint today is worth more than one from last month.
When to use it: We find this model works exceptionally well for e-commerce brands with frequent promotions.
If you run a weekend sale, you want the ads from that week to get the credit, not the SEO article they read last year.
The “Lookback” Tip: Most platforms default to a 7-day or 30-day half-life. If your business has a 6-month sales cycle (like home construction), the default settings will punish your early marketing efforts too severely. You must adjust the decay window to match your actual sales cycle length.
Pros: It reflects the reality that recent urgency drives sales; it rewards channels that drive action.
Cons: It still undervalues the introduction. If you stop your top-of-funnel marketing because of Time-Decay data, your sales will eventually dry up.

5. Position-Based (U-Shaped) Attribution
Position-based attribution splits the credit between the opener and the closer.
It typically assigns 40% to the first touch, 40% to the last touch, and spreads the remaining 20% among the middle interactions.
When to use it: This is the standard model we recommend for most growing businesses.
It forces you to respect both the channel that found the customer and the channel that closed them.
The “B2B” Advantage: For businesses with a sales team, this model aligns marketing and sales. Marketing gets credit for the 40% “Introduction,” and Sales gets credit for the 40% “Close.” It stops the internal fighting over who brought in the deal.
Pros: Balances growth (discovery) with revenue (closing); gives some credit to nurturing.
Cons: The 40/40/20 split is a rigid rule, not a data-backed fact. For some businesses, the middle 20% (like a demo or a showroom visit) is actually the most important part.
6. W-Shaped Attribution
W-shaped attribution adds a third pillar to the model: the “Lead Creation” moment.
The credit is split 30% to the First Touch, 30% to Lead Creation (e.g., filling out a form), and 30% to the Last Touch (the sale). The final 10% is shared among the rest.
When to use it: This is the go-to model for companies using marketing automation tools like HubSpot or Salesforce.
It is specifically designed for funnels where a user becomes a “Lead” long before they become a “Customer.”
The CRM Requirement: You cannot run this model effectively without a CRM that tracks the exact moment a visitor becomes a lead. If your data isn’t clean, this model breaks down instantly.
Pros: It values the “conversion to lead” moment, which is the primary goal of most marketing teams.
Cons: It is complex to set up. It requires tight integration between your website analytics and your CRM.
Comparison: U-Shaped vs. W-Shaped
| Feature | Position-Based (U-Shaped) | W-Shaped Attribution |
|---|---|---|
| Focus Points | Discovery + Closing. | Discovery + Lead Gen + Closing. |
| Primary User | E-commerce, Local Services. | B2B SaaS, High-Ticket Sales. |
| Key Advantage | Simple balance of top/bottom funnel. | Values the “Lead” definition. |
| Complexity | Moderate. | High (Requires CRM sync). |
7. Custom (Algorithmic) Attribution
Custom attribution models allow you to build the rules from scratch.
You can tell the system, “If a user watches 50% of a video, give that channel 2x credit.”
When to use it: We only recommend this for sophisticated teams spending over $50,000 a month on ads.
At that scale, off-the-shelf models might hide the nuances of your specific customer journey. Tools like Northbeam or Rockerbox (popular in the US) are built specifically to handle this level of customization.
The “Whale” Warning: Don’t build a custom model just to feel smart. We have seen businesses create complex rules that accidentally validate their own biases. Unless you have a data scientist on staff, sticking to a standard model is usually safer.
Pros: Perfectly tailored to your business goals; accounts for offline data and unique behaviors.
Cons: Extremely expensive and difficult to maintain. If you change your marketing strategy, you often have to rewrite your model.
8. Data-Driven Attribution
Data-driven attribution (DDA) uses machine learning to assign credit based on probability.
It compares the paths of customers who converted against those who didn’t to calculate the “Shapley value” (actual impact) of each touchpoint.
When to use it: This is the current gold standard, and it is the default in Google Analytics 4 (GA4).
However, it only works if you have enough data to “train” the algorithm.
The “Cold Start” Reality: While Google pushes this as the default, it has strict minimums. For the model to be statistically significant, you typically need at least 300-600 conversions per month. If you are a local business with 20 sales a month, this model will often default back to Linear or Last-Click without telling you.
Pros: Removes human bias; adapts automatically as consumer behavior changes.
Cons: It is a “Black Box”—you cannot see why the computer assigned credit, only the result. It requires significant volume to work correctly.

How to Choose the Right Model
There is no “perfect” model, but there is definitely a wrong one for your specific stage of business.
We guide our clients through a simple checklist to make this decision.
1. Check your Sales Cycle If your customers buy instantly (e.g., locksmith, pizza delivery), stick to Last-Touch. The complexity of multi-touch models won’t add value to a 10-minute decision process. If your sales cycle is over 30 days, you need Position-Based or Time-Decay.
2. Evaluate your Growth Phase Are you trying to enter a new market? Use First-Touch to see what grabs attention. Are you trying to maximize profit from existing traffic? Use Last-Touch or Time-Decay to optimize for efficiency.
3. Audit your Data Volume Do not turn on Data-Driven Attribution if you have fewer than 300 conversions a month. The algorithm will just guess. Stick to a rule-based model like Position-Based until your volume increases.
4. Assess your Tech Stack W-Shaped attribution is powerful, but it requires a perfectly synced CRM. If your sales team keeps leads on sticky notes or personal spreadsheets, this model will fail. Start with a model that matches the tools you actually use today.
Our Recommendation: For most business owners moving away from basic analytics, Position-Based (U-Shaped) is the best starting point. It respects the marketing that brings people in and the sales effort that closes them. It stops the argument between “brand awareness” and “direct response” by giving credit to both.
Conclusion
Attribution models are not just technical settings; they are financial decisions.
The model you select defines which team members get bonuses and which channels get budget increases.
Moving from a single-touch model to a multi-touch attribution approach is often the highest-leverage change a business can make to its marketing efficiency.
Start with the model that reflects your current business reality, not the one you aspire to have in five years.
If you aren’t sure where to begin, check your current default settings—you might be making six-figure decisions based on data that ignores half your funnel.